A New Wave of Abstraction
Understanding always requires a radical simplification of what really is to what can be held-in-mind and used.
— artist Ward Shelley (2010)
Morning, June, Evanston, near Chicago. It’s a warm walk from my hotel to the campus of Northwestern University, passing under elevated tracks into clusters of brick buildings with green lawns. The grasses and I enjoy spray from the sprinklers chugging in circles. Yesterday I spotted a small beautiful rabbit crouching beneath the shrubbery. Today an orange streak startles me; as the narrow body leaps the curb, I realize it’s a fox. I’m headed to a day of talks on Arts, Humanities, and Complex Networks, where I will see some old friends and meet some new ones.
Everything I am experiencing can be drawn as a network: an ecological network, a transportation network, a social network. The substances circulating and the nerves firing in my body as I interact with my surroundings can usefully be described as interconnected networks. A network — the electrical grid — will power my computer as it responds to the network of routers and wireless signals. Sitting in the tiered classroom seats with me today will be anthropologists, archaeologists, art historians, and artists; graphic designers, linguists and psychologists. Plus quite a few biologists, economists, physicists, mathematicians, and computer scientists who are in town for NetSci, the scientific conference of which the symposium I am attending is a satellite. So what is this idea that gets people working in so many different fields talking to each other?
The Swiss army knife of structural models
In the past decade, network has proved to be a useful framework to model structural complexity of complex systems. By abstracting a complex system into nodes (constituents) and links (interactions between them), the resulting graph could be efficiently treated analytically and numerically, through which a large body of new physics of complex systems has been acquired.
— physicists Won-kuk Cho et al (2010)
The most functional multi-tool on the market, says the marketing copy for the Original Swiss Army Knife. The most functional multi-tool for explaining the universe, we could say of networks. That might be a bit grandiose, but a stroll through the website Visual Complexity, “a unified resource space for anyone interested in the visualization of complex networks,” will take you past network representations of metabolic pathways, neuronal nets, subway systems, campaign contributions by oil and gas companies, system calls on Windows and Linux servers, and Dead Kennedys’ albums. . . just for starters.

Detail from the Visual Complexity home page
The theory that informs these visualizations took off at the turn of the 21st century, as new digital tools fed theoretical research on complex systems with massive amounts of empirical data. One of the movers and shakers behind NetSci, physicist Albert-László Barabási, outlines the significance of this development for science in an articulate and accessible commentary for Nature Physics. He believes that network theory will transform the twenty-first century in much the same way that quantum mechanics influenced the twentieth.
So what about art?
…the problem one faces is to invent a style for each work which allows one to enter the art context but which is not lacking in specificity in such a way that the political thrust vanishes into the dominant esthetic of the present.
— artist Hans Haacke (1984)
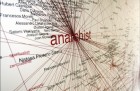
As network theory has developed, so have visual styles for representing networks. You’ve probably seen the most common diagram type, in which the nodes and links are drawn as dots and lines, respectively. Turkish artist Burak Arikan, who presented his work at the symposium, applied this style in his Network Map of Artists and Political Inclinations (2011), which maps the political leanings of 4592 artists who applied to the 7th Berlin Biennale, based on their responses to a questionnaire. Arikan wrote the software that positioned the names in the network, a process which requires significant visual decisions. Elements such as typography, line weight and node positioning can differ greatly in diagrams that show exactly the same information. Arikan has a feel for making the information beautiful; in the final, mural-size digital print, the opinion clusters burst in the picture space like fireworks.

Burak Arikan, Network Map of Artists and Political Inclinations, 2011
As with the historical precedents I mentioned, the data for Network Map of Artists and Political Inclinations was volunteered. And therein lies a significant difference between the content of Arikan’s diagram and the content of many working twenty-first century network diagrams. The huge pools of data created in the course of our digital lives are a boon for scientific efforts to understand biological, economic and social behaviors; as they add to knowledge they create power. There is reason for us to notice this power, to talk about it and picture it and negotiate its uses. Although the named and known political positions in Arikan’s diagram may seem like the meat of the piece, it could be the resistant mass of individuals who “declined to state” that makes the most salient point. Their cloud, hovering at the edge resisting neat subdivision into categories, could contain thunder.
Other places we might go
…every major scientific advance has artistic repercussions…
— art critic Roberta Smith (2012)
To date there have been three Arts, Humanities, and Complex Networks satellite symposia, starting with the 2010 NetSci in Boston. (Papers from that meeting are collected in an e-book linked below). Each meeting has reflected the cross-disciplinary breadth of the organizers: astronomer Roger Malina, information designer Isabel Meirelles, and art historian Maximilian Schich. Malina is also the long-time executive editor of the Leonardo publications at MIT Press; Leonardo is the meeting’s organizational sponsor. Both Schich and Mireilles have worked with Barabási’s lab at Northeastern University. Barabási, who has woven sophisticated contemporary art into his deservedly popular accounts of network science Linked and Bursts and included artist speakers in the NetSci schedule, deserves a shout-out for establishing the climate in which this symposium could flourish.

Jane Prophet, Counterbalance, 2007
For a culturally curious person, the presentations have been a mind candy feast, with papers ranging from “The Social Network of Dante’s Inferno” to “Network Science: A New Method for Investigating the Complexity of Musical Experiences in the Brain,” and “Net-working with Maciunas.” Artists including Anna Dumitriu, Jon Ippolito, George LeGrady, Jane Prophet, Ward Shelley, and Tranzit.org have presented their work along with rock stars of information design such as Fernanda Viégas, Martin Wattenberg and Miriah Meyer. Speakers know they will have a mixed audience, so they take care to make their material accessible.
The talks at the main NetSci conference also range through many disciplines, although they often hold mysteries for listeners who’ve missed out on mathematics. But those talks, too, are full of provocative ideas for people in the arts. I’ve already spent some time riffing on Jon Kleinberg’s talk “Mechanisms for (Mis)Allocating Scientific Credit,” next time I’ll venture into some wild ideas on networks and global art history.
LINKS
Burak Arikan
Albert-László Barabási
E-book of the 2010 Art, Humanities, and Complex Networks symposium
